
As should be very obvious from how governments around the world have dealt with recent pandemic difficulties, science does not deal in absolute certainty. We often hear that they are ‘following the science‘ but I suspect that allows enough wiggle room for them to do what is politically most appealing.
Science deals with probability and does not provide absolute proof. Proof is the domain of mathematics – we are not going suddenly to discover that triangles do not have angles that add up to 180°. It’s a fact – assuming the triangle is drawn on a flat surface. Oh no – there I go adding a condition! Science looks at the evidence and tries to draw the best conclusions that it can. The better the evidence, the more confident the conclusion can be.
The more confident you are about your conclusion, the narrower the confidence interval can be. This is also why it matters how many significant figures you use when answering exam questions. Too many significant figures might make you more confident of your answer than you should be. You don’t want to round off so much that your answer is way off the mark but you also don’t want to express an answer to so many decimal places that you could not possibly be confident that all the numbers are correct. Getting this right is both an art and a science, but for now you need to develop a feel for what level of precision is appropriate.

The red line is the average of each set of five blue dots so it weaves its way through through the data showing the general trend of changing temperature over time.
When you draw a line of best fit on a graph you are estimating/approximating the results to show a trend. Computers can be used to draw the perfect smooth curve but identifying a trend is a useful skill for you to develop. Science has a lot to do with best guesses and the most probable answer – when the evidence changes then so does the conclusion.
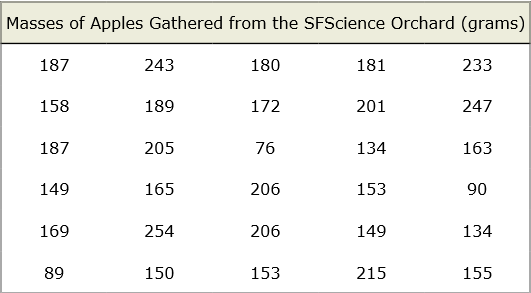
If you have quite a small set of data you may need to look out for anomalies before you calculate your average otherwise rogue results can skew your final answer. In the table above, I would be inclined to exclude the three apples under 100 grams. They are so different that I suspect something must have gone wrong. Perhaps they were not fully formed or maybe they had been half eaten by an animal. If you include them the average for all the apples is 173.1 g (173 g to three sig figs). Without them the average is 182.8889 g. As always, a sensible number of significant figures is called for. I think you could express the average as 183 g. As long as you show your working and explain why you have left out certain values your work can be checked by other scientists.
Questions…
- If gravity on Earth has a value of 10 N/kg, what is the weight of an average SFScience apple?
- Which naturally occurring gas is chiefly responsible for the increase in the Greenhouse Effect?
- On a science graph, which variable usually goes on the x axis?
- What is 1.0045637 expressed to four significant figures?
- What two things affect the width of a confidence interval?
1. 1.83N
2. Carbon Dioxide
3. The independent variable
4. 1.005
5. Variation and sample size
Q1 – good
Q2 – yes, but try to avoid capital letters for chemicals
Q3 – splendid
Q4 – excellent
Q5 – well done
Happy New Year!